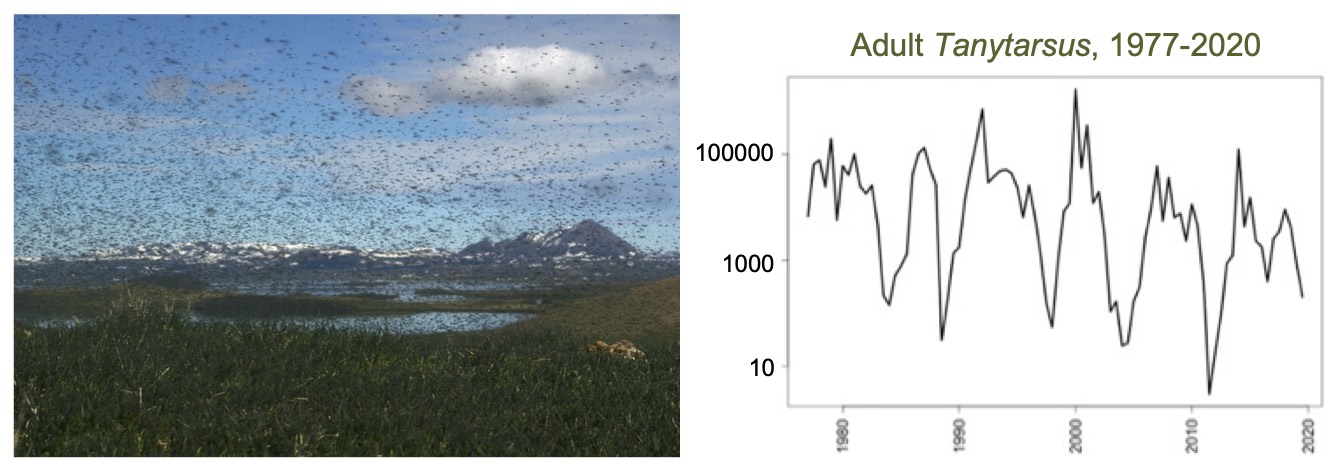
A central lesson from theoretical ecology is that even simple ecological processes can cause complex, dramatic dynamics. An extreme example of this lesson is midges in Lake Mývatn, Iceland, where midge abundance fluctuates over five orders of magnitude, with crashes occurring irregularly every 4-10 years. The spatiotemporal dynamics of species depend on the strong interactions they have with species in a community, and in turn the dynamics of a single species can drive community-level changes. Understanding species and community dynamics, and how they are affected by environmental changes, requires a combination of long-term observations to document dynamics, targeted experiments to investigate underlying mechanisms, and theory to formulate and test hypotheses about why species and communities have the dynamics they do.
Ecological and Evolutionary Interactions
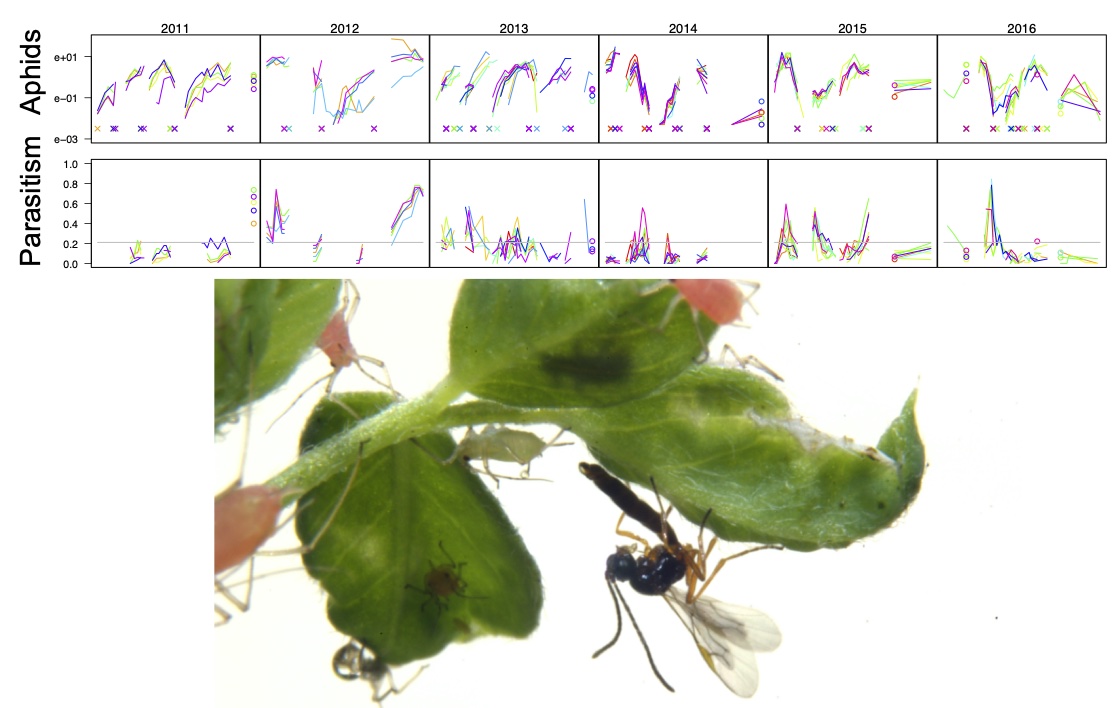
Ecological and evolutionary processes can operate on the same time scales when ecological forces are sufficient to drive strong selection. For example, pea aphids may be resistant to parasitism by parasitoid wasps, a trait conferred in part by bacterial symbionts. Because parasitism varies tremendously through space and time in the agricultural system we study, there is a spatiotemporal mosaic of selection for resistance that underlies the globally stable (persistent) ecological-evolutionary dynamics of aphids and parasitoids. Fusing theoretical and experimental approaches from ecology and evolution gives a richer understanding of both ecological and evolutionary dynamics.
Statistics for Ecology and Evolution
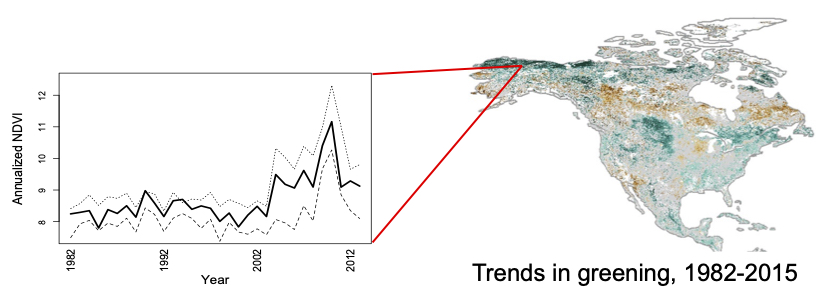
Combining mathematical theory with experiments and/or observational data benefits both: theory can generate hypotheses that are then tested with data, and data can keep theory grounded in reality. Statistics is the tool for combining theory and data. For anything other than testing the simplest of hypotheses, familiar statistical methods are inadequate and even misleading. For example, how would you analyze global patterns of greening (NDVI) from remote-sensing datasets? There are millions of pixels of data yet nearby pixels all show similar trends: the millions of pixels are all correlated, so there aren’t millions of independent data points. Statistically bridging the gap between mathematical theory and data is challenging, but the payoff is new insights into the complex spatio-temporal ecological and evolutionary dynamics shown by real systems.